
The Finance Professional’s First Python Script: From Zero to Forecast in 30 Minutes
A hands-on walkthrough for people who think coding isn’t for them.

If you’re a finance professional who’s never written a line of code, this article is for you. Not for “technical” finance people. Not for quants. For the person who lives in spreadsheets, thinks in pivot tables, and has been told they should “learn Python” but doesn’t know where to start.
I’m going to walk you through building your first Python script. By the end, you’ll have a working revenue forecast. It won’t be perfect. It won’t replace your existing process. But it will show you what’s possible, and it will demystify the tool that everyone keeps telling you to learn.
Setting Up (5 Minutes)
Forget installing anything on your computer. Open a web browser and go to Google Colab (colab.research.google.com). It’s free, it runs in your browser, and Python is already set up. Click “New Notebook” and you’re ready.
You’ll see a blank cell. That’s where you’ll write code. Think of each cell like a single formula in Excel, except it can do much more.
In that first cell, type the following and hit Shift+Enter to run it:
import pandas as pd
import numpy as np

from datetime import datetime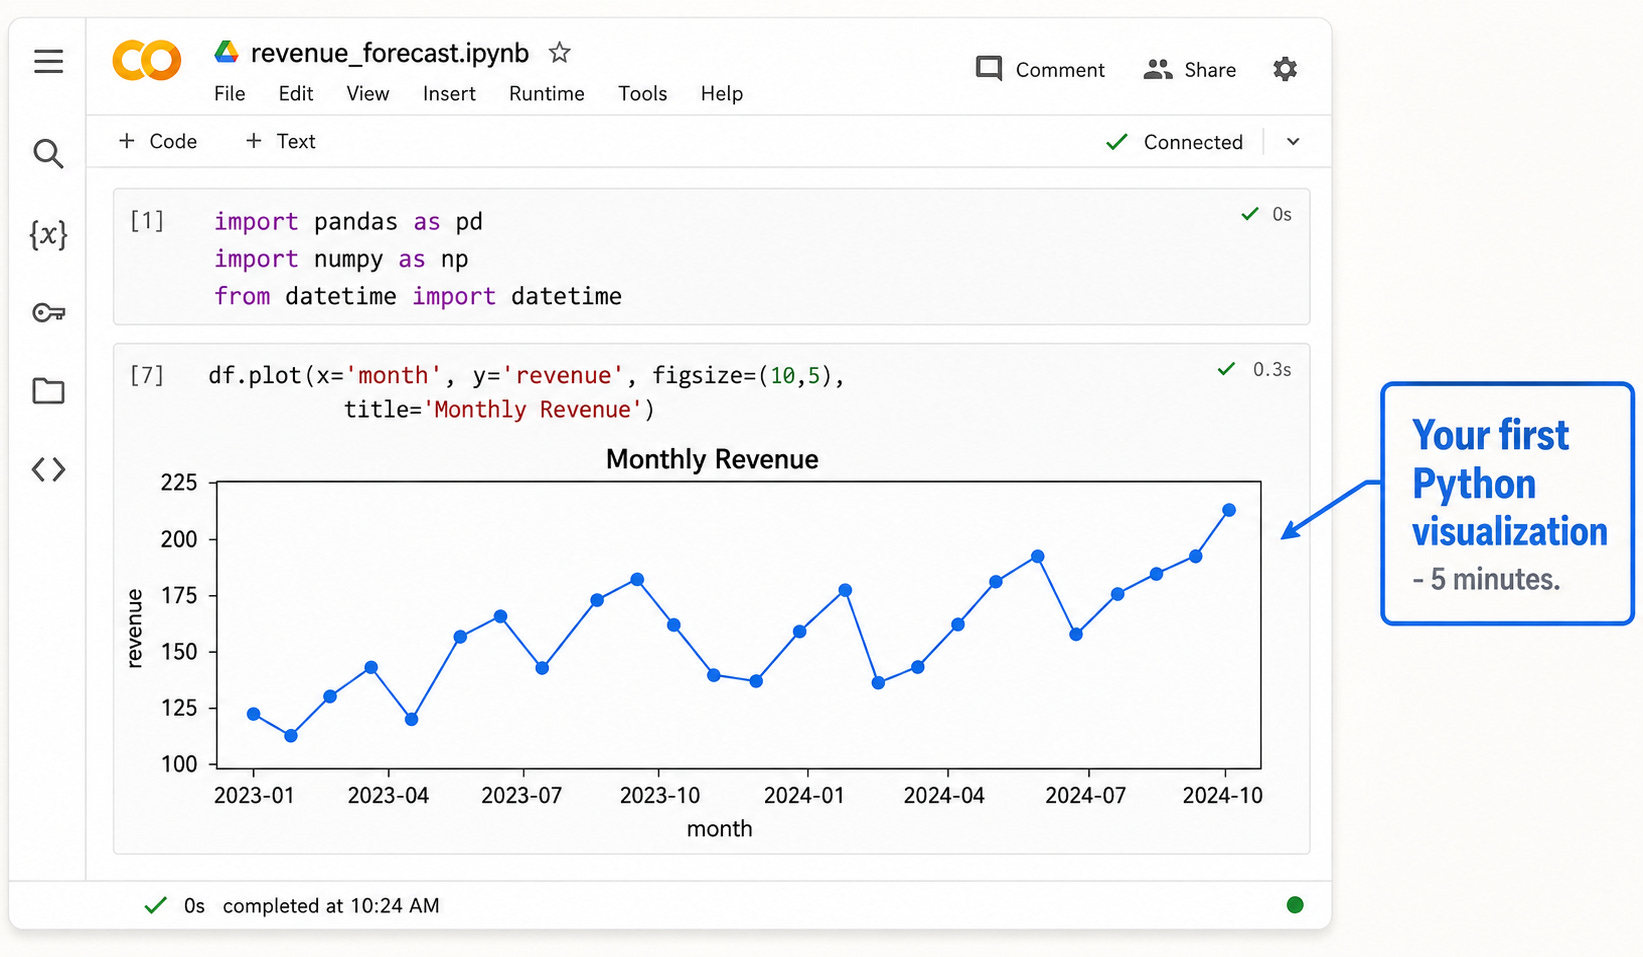
That’s it. You just loaded three Python libraries. pandas handles data (think of it as a supercharged spreadsheet). numpy does math. datetime handles dates. Every Python finance script starts with something like this.
Creating Your Data (5 Minutes)
In Excel, you’d open a file. In Python, you can load files too, but let’s start by creating some sample data so you don’t need to worry about file formats yet.
In a new cell, type this:
months = pd.date_range(’2023-01-01’, ‘2024-12-01’, freq=’MS’)

revenue = [120, 115, 130, 140, 125, 155, 160, 145, 170, 180, 165, 195, 135, 128, 145, 158, 142, 172, 178, 162, 188, 198, 182, 212]

df = pd.DataFrame({’month’: months, ‘revenue’: revenue})
You just created a dataframe — Python’s version of a spreadsheet table. It has 24 months of revenue data. The pd.date_range function generated monthly dates, and df is your table.
Type df in a new cell and run it. You’ll see your data displayed as a clean table. That’s your first aha moment — you can see and interact with data just like in Excel.
Want to go further with AI in finance? I’m part of the AI Finance Club — a community of 10,000+ finance professionals sharing tools, prompts, and real use cases every week. Join the club here
Exploring Your Data (5 Minutes)
In Excel, you’d scroll around, maybe create a chart. In Python, it’s just as easy but more powerful.
Try df.describe() in a new cell. Instantly, you get count, mean, standard deviation, min, max, and quartiles. That’s six clicks of analysis in Excel done with one line.
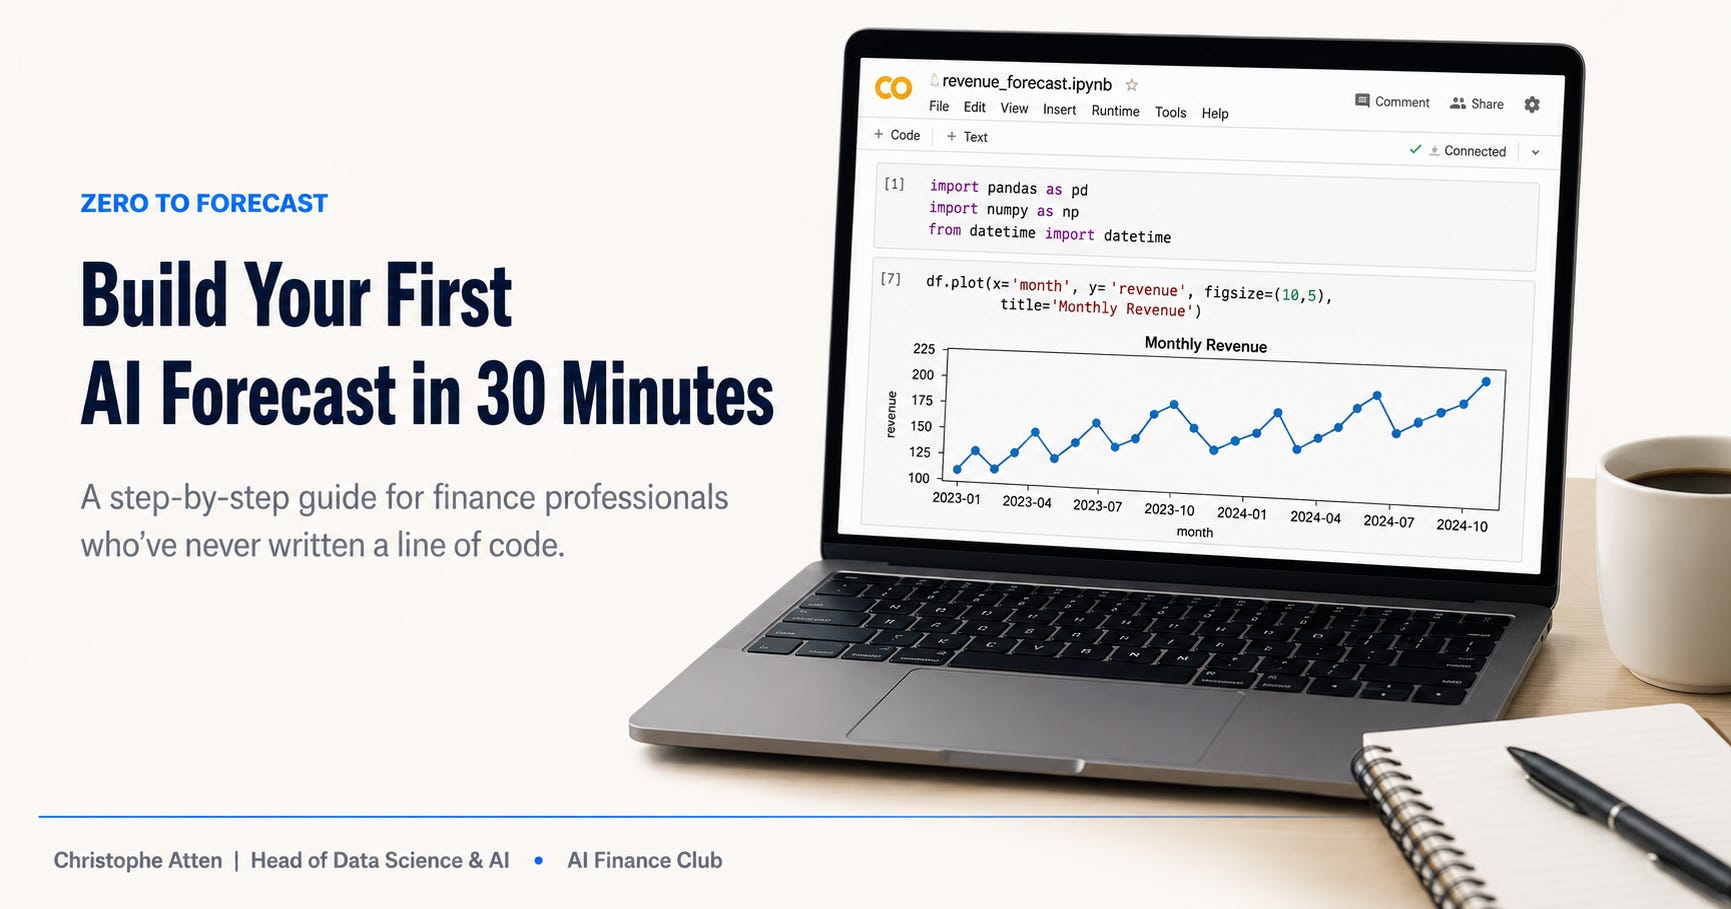
Now let’s visualize it. In a new cell:
df.plot(x=’month’, y=’revenue’, figsize=(10,5), title=’Monthly Revenue’)
Run it, and you’ll see a line chart of your revenue data. Look at it — there’s a clear upward trend with some seasonal variation. That’s exactly what we’re going to forecast.
Building the Forecast (10 Minutes)
Now for the part that would take significant effort in Excel but takes just a few lines in Python. We’re going to build a simple forecast using linear regression. Don’t worry about the math — Python handles it.
In a new cell:
from sklearn.linear_model import LinearRegression

df[’month_num’] = range(1, len(df)+1)

model = LinearRegression()

model.fit(df[[’month_num’]], df[’revenue’])
That’s it. Four lines. You just trained a machine learning model. The model looked at the relationship between time and revenue and learned the underlying trend.
Now let’s use it to predict the next 6 months:
future_months = pd.DataFrame({’month_num’: range(25, 31)})

future_months[’forecast’] = model.predict(future_months[[’month_num’]])
Type future_months and run it. You’ll see six predicted revenue values. Your first AI-generated forecast.
Making It Useful (5 Minutes)
Let’s visualize the historical data alongside the forecast. In a new cell:
import matplotlib.pyplot as plt

plt.figure(figsize=(12,6))

plt.plot(df[’month’], df[’revenue’], marker=’o’, label=’Actual’)

future_dates = pd.date_range(’2025-01-01’, periods=6, freq=’MS’)

plt.plot(future_dates, future_months[’forecast’], marker=’s’, color=’red’, linestyle=’--’, label=’Forecast’)

plt.title(’Revenue: Actual vs Forecast’)

plt.legend()

plt.show()
Run it and you’ll see your historical revenue with the forecast extending into the future. Blue for actual, red dashed for predicted.
What You Just Did
In about 30 minutes, with zero prior coding experience, you loaded data into Python, explored it with built-in statistics, visualized it as a chart, trained a machine learning model, generated a six-month forecast, and created a professional visualization showing actuals versus predictions.
Could you do all of this in Excel? Most of it, yes. But here’s the difference: this script is reusable. Next month, when you have new data, you change one line (the revenue list) and run the whole thing again. In 10 seconds, you have an updated forecast with a new chart.
And this is just the beginning. Once you’re comfortable with this basic pattern, you can layer in more sophisticated techniques: seasonal decomposition, multiple regression with additional variables, even deep learning models. But the workflow is always the same: load data, explore, model, visualize.
The Honest Next Steps
This script is deliberately simple. A real forecasting model would need to account for seasonality, external factors, confidence intervals, and model validation. Linear regression is a starting point, not a production solution.
But that’s not the point of this exercise. The point is to show you that Python isn’t magic, it’s not impossibly difficult, and it’s not just for engineers. It’s a tool. Like Excel, but for a different set of problems. And now you’ve used it.
Save this notebook. Come back to it next week and try modifying the data. Change the revenue numbers. Add more months. Try forecasting 12 months instead of 6. Each small experiment builds familiarity, and familiarity builds confidence.
Welcome to Python. It’s not as scary as you thought, is it?
If you want daily AI + finance insights from a community of practitioners, join me in the AI Finance Club
If you’re ready to build real AI skills with live coaching and hands-on exercises, check out the next cohort of the AI Finance Accelerator